The TL;DR
Global warming has been one of the biggest problems the world is facing today. In particular, the increasing ocean temperature affects marine species and ecosystems. This increase can cause coral bleaching and in turn, loss of breeding grounds for marine animals. In this exercise, we discover knowledge using data from the Tropical Atmosphere Ocean (TAO) array which was developed by the international Tropical Ocean Global Atmosphere (TOGA) program. In particular, we would like to know what are the indicators of a sea surface temperature increase. Here, we found that air temperature and sea surface temperature are highly correlated with each other and as such, we remove air temperature from our predictor variables. The final linear model is as follows:
sea_surface_temp = 5.955*latitude + 0.3791*longitude + 0.3295*zonal_winds
                   - 0.8165*meridional_winds - 1.126*humidity
with an error of 16.86%. From here, we can see that increasing the latitude, longitude and zonal winds also increases the sea surface temperature. On the other hand, the lower the meridional winds and the humidity, the higher the sea surface temperature will be. We can use these insights in detecting possible triggers for sea surface temperature increase.
The Long Cut
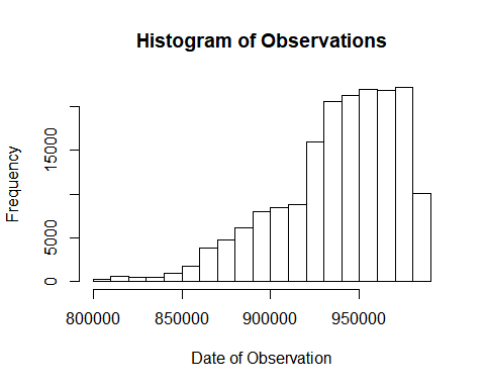
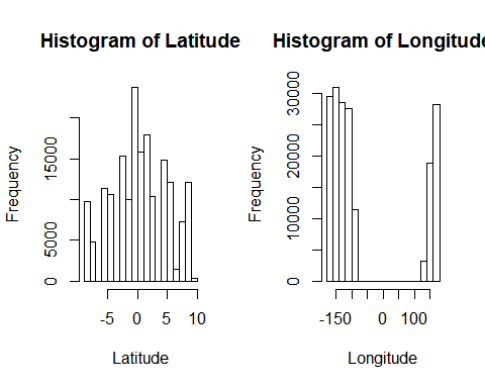
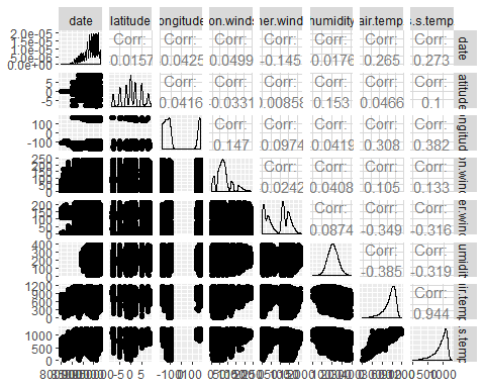
We first look at the histogram of the date, so we can see the distribution of observations based on time. From here, we can see that as time passes (at around 1993 to 1994), there has been an increase in the number of observations. We also check the histogram of the longitude and latitude: the longitude has more values at around -150 and 150 while latitude has a more normal distribution. Finally, we check the values for the other variables.
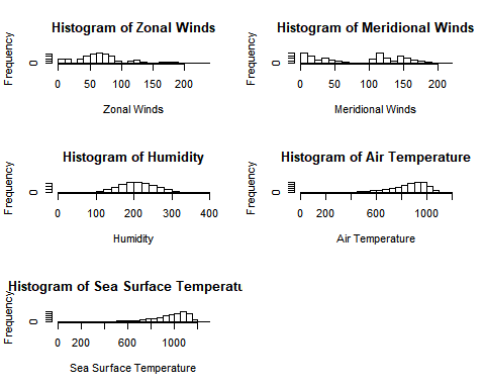
From the plots, we can see that the Zonal Winds have a peak around 70. For Meridional Winds, the distribution appears to have a peak around 0 and another at 110. Humidity, Air Temperature and Sea Surface Temperature distributions appear to be relatively normal, with the latter two being skewed to the right.
We look at the correlation of the variables with each other. From the correlation plot, we can see that air temperature is highly correlated to the sea surface temperature. As such, we would like to remove air temperature in our analysis since we want to know the variables affecting sea surface temperature.
We can see that all of the variables are significant with a significant over-all p-value. As such, we can say that the sea surface can be modelled using all other variables.
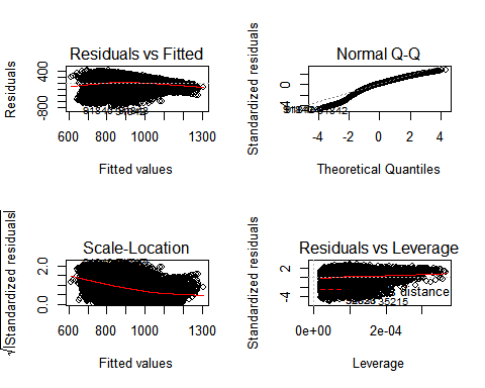
We look at the model diagnostics we created, then at the prediction power, and found that our error is 16.86%. The full code can be found at github.com/rlbartolome/elnino.