For this blog, I'll teach you how to segment a certain portion in an image. I think it's better to show what will happen in pictures.
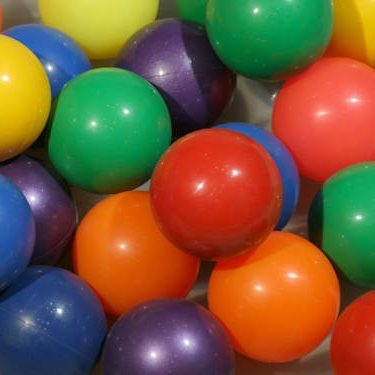
The picture used is an image of different colors of plastic balls. It is really an epic picture. What we will do is separate (or segment) the balls according to color. We are going to use two ways in order to do this. In both ways, we are required to represent the color space (not the usual Red-Green-Blue) into pure color information. The normalized chromaticity coordinates (NCC) can be used where the brightness and chromaticity of the picture is well-represented [1].
To represent the color space into NCC:
R = Ic(:,:,1); G = Ic(:,:,2); B = Ic(:,:,3);
Int = R + G + B;
Int(find(Int==0)) = 1;
rc = R./Int; gc = G./Int;
We first separate the Red, Green and Blue components of the image. Then we get the sum of these components. To prevent the world from being destroyed, we avoid dividing by zero by assigning all values with zero to 1. Finally, we divide the R component with the sum of the RGB components to get the NCC for red, and divide the G component with the sum of the RGB components to get the NCC for green. Only two components are needed.
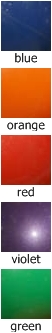
Next we need a Region of Interest (ROI), against which we compare the bigger image. For the image of the balls, an ROI can be a small square of a certain color. And we are ready! I'll tell you the two ways for segmentation:
1) Parametric Segmentation (PS)
In PS, we shall find the NCC of both the original picture and the ROI first. Let's call these r_original and g_original for the NCC of the original picture and r_ROI and g_ROI for the NCC of the ROI. The next thing we do is get the standard deviation and mean of r_ROI. After this step, we get a single value of the standard deviation and the mean. We then substitute it to the Gaussian equation, with r being the r_original (which will be a matrix). After that, we do it again for the green NCC. Finally, we multiply the probability distribution of the red and green to get the segmented image.
2) Non-parametric Segmentation (NPS)
In NPS, we first obtain a 2D histogram of the ROI using the NCC. Then, the histogram from the ROI is back projected to the original image's NCC. It really sounds simple but it's more complicated than that.
Results
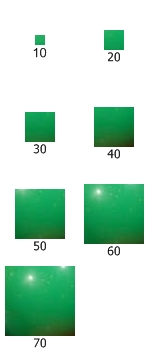
I extended this work by investigating the use of different ROI colors and sizes. Different ROIs were obtained — five colors were used — and different ROI sizes were also used.
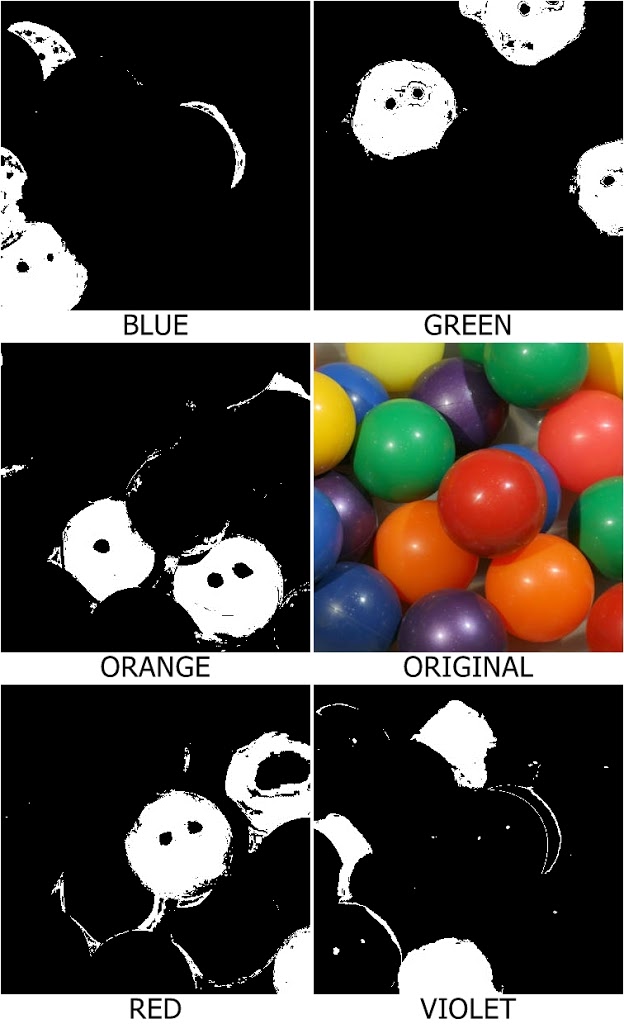
1. Parametric Segmentation. As seen in the segmented images, the colors blue, green and violet were successfully segmented while the colors red and orange had some noise. This is because red and orange are slightly of the same hue.
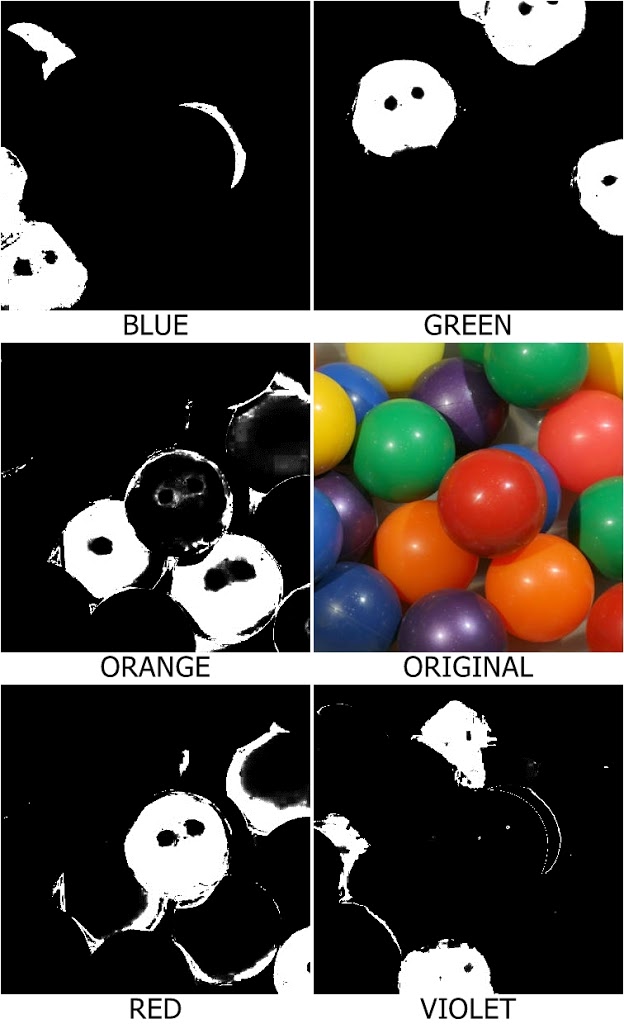
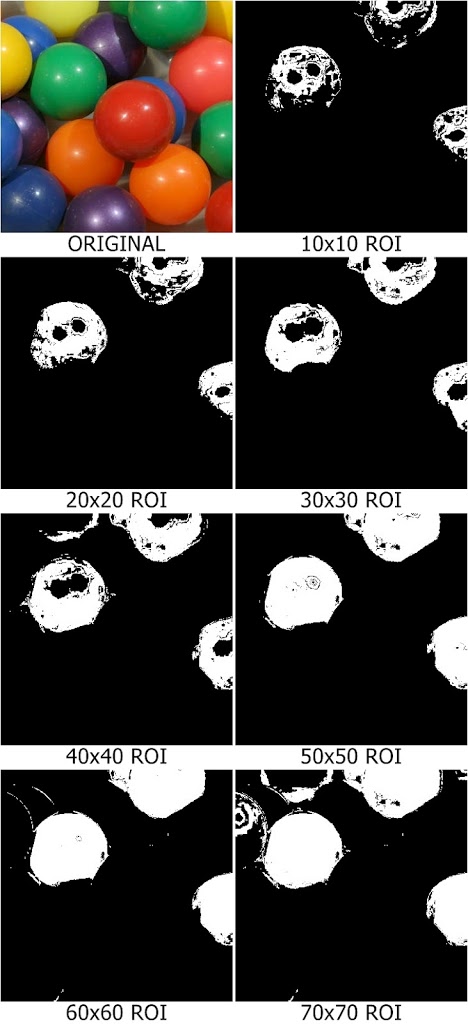
The effect of the size of the ROI was also studied. It can be seen that a larger ROI produces a larger segmented image. This is probably because a larger ROI has higher standard deviation allowing more colors to be segmented.

2. Non-parametric Segmentation. For the colors, it is almost the same as PS but the color violet has more residues. The code actually detects the blue-ish colors as violet. This is understandable because blue and violet are near to each other in the visible spectrum. As for the increasing ROI size, as expected, a larger ROI has larger standard deviation and therefore has a larger area segmented.
Comparing the PS and NPS techniques, I prefer the PS method. First, the run time for PS is faster than that of the NPS. NPS utilizes the for loop in back projection and it takes some time while the PS just loads in an instant. Second, PS produces segmented images with a more defined edge.